A river moves in two ways. Water flows, while the channel itself can change position. We can watch the first movement immediately from a bridge. The second often exceeds the length of a visit. Images from different years reveal that even a familiar bend is not a permanent backdrop.
Flowing water is not a migrating bank
A fast current does not establish that its bank has migrated far that day. Flow, channel shape and channel position are different things to observe. Keeping them separate in language helps. Are we describing moving water, or comparing the position of a bank? That question prevents an impressive snapshot from quietly becoming evidence of a long-term trend. To examine the second movement, we need an earlier spatial reference and an explicit comparison period.
The documented case: the Ucayali
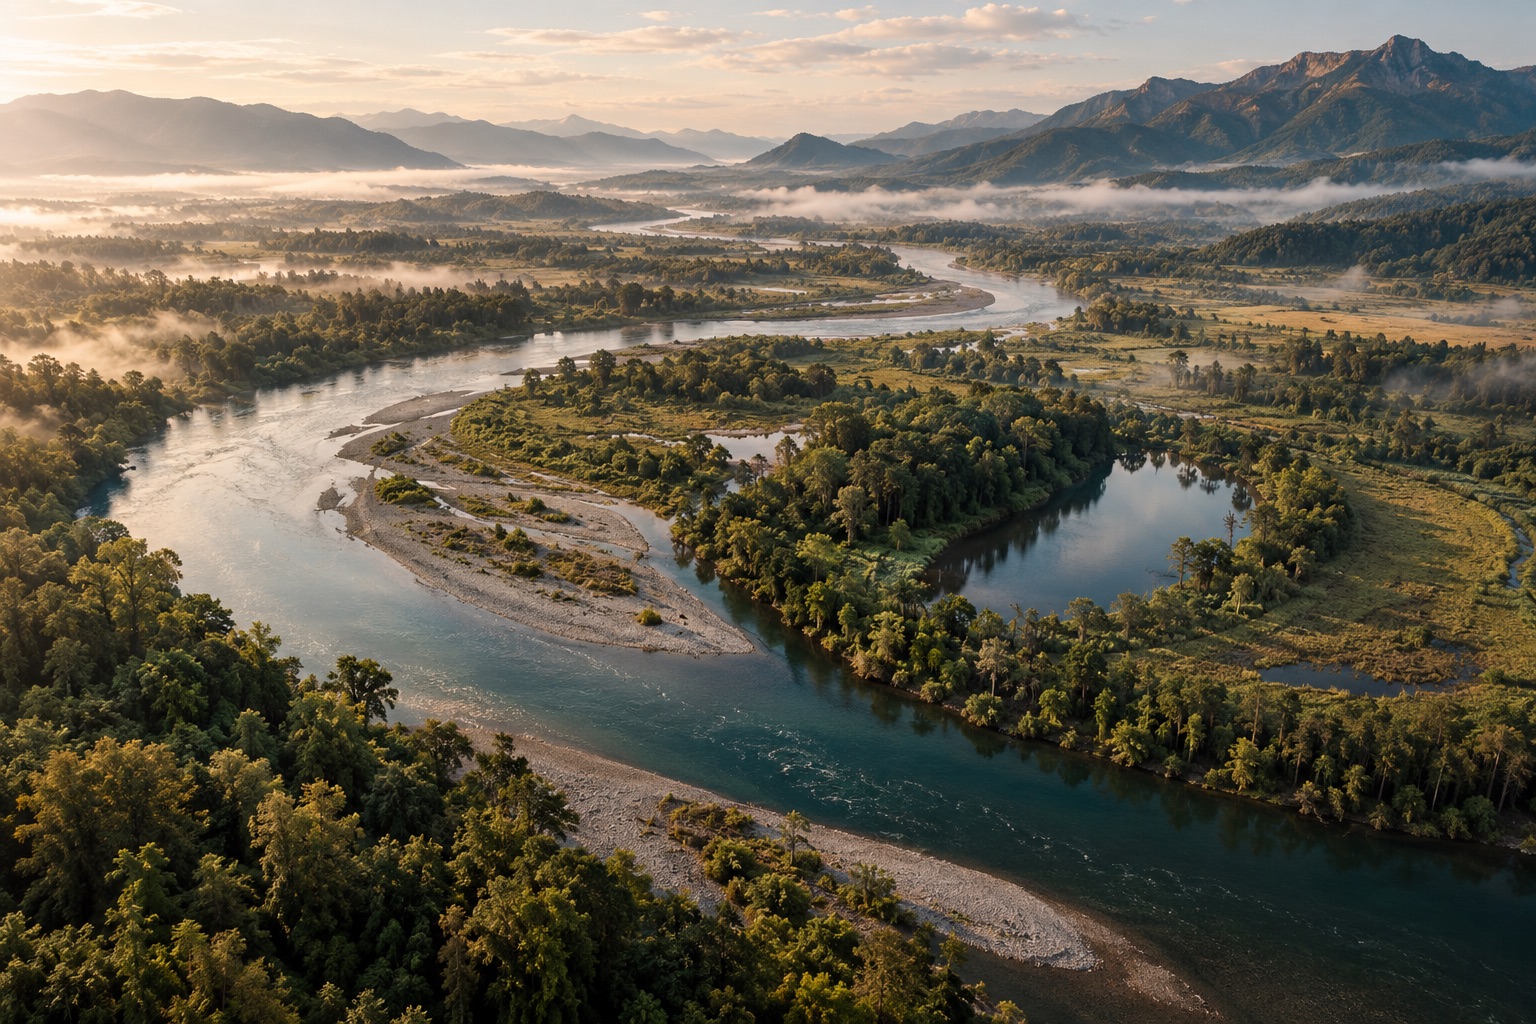
In a report on research presented in 2019, NASA shows Landsat imagery of Peru’s Ucayali River spanning 1985 to 2013. The extended comparison reveals changing bends and cut-off loops. Its period is part of the claim: these are historical observations across several decades, not a new survey of the river in 2026. Our opening illustration is an artistic scene with no such image history. Both can invite attention, but only the documented sequence supplies observations of that particular place over time. [1]
One bend, three different questions.
A guide to reading river images. These cards do not simulate migration or show measured velocities.
- SHAPE
Where is curvature greatest?
A single image can show shape, but cannot establish its rate of change.
- COMPARISON
Where does the bank migrate?
Spatially aligned images from different years make displacement testable.
- FINDING
Maximum migration is displaced
In the reported Amazonian study, the maximum occurred downstream of greatest curvature. This is a research finding, not a rule for every river.
Ucayali period and research finding follow NASA; process terms follow NPS. [1] [3]
What the researchers compared
NASA describes research examining hundreds of bends on seven Amazonian rivers over roughly three decades. The comparison concerned curvature and migration. Maximum migration occurred downstream of maximum curvature. That finding is more precise than the intuitive idea that a river must move most strongly exactly where it bends most sharply. Shape and change are related, yet their maxima need not occupy the same location. The study therefore adds a spatial relationship that an isolated attractive river photograph could not establish. [1]
A finding with an explicit scope
The environments described do not justify automatic transfer to every canal, rock gorge or engineered bank. NASA identifies the importance of human and geological influences when discussing the result’s scope. Such boundaries do not weaken a scientific explanation. They make it more testable: we learn which situations informed it and which additional conditions another river would require us to examine. A striking bend by itself cannot predict how it will migrate or whether the same relationship applies there. [1]
Water arrives from a larger area
The USGS explains rivers in relation to their catchments. Water reaches them through surface runoff and groundwater inputs, while human interventions can alter those connections. Explaining a visible stretch therefore does not end at the picture frame. Conditions on the dates being compared matter. Two different widths of visible water might reflect different water levels. That would not, by itself, fully describe a lasting change in channel position. A wider geographical context can prevent a local picture from carrying more meaning than it supports. [2]
Erosion here, deposition there
The NPS describes erosion and deposition reshaping channels, with channel form related to slope, discharge and sediment. A river view may therefore suggest several movements at once: material is released, transported and deposited. Loss on one side can appear as a new surface in another view. Interpreting that change requires distinguishing the water boundary, the bank and possible sediment surfaces, rather than treating every bright patch as permanent new land. These distinctions remain useful even when no numerical measurements are available. [3]
How to read an image comparison
Start with dates, scale and orientation. Find stable reference points beyond the changing bank and ask whether the images cover the same area. Describe visible differences before explaining them. “The water surface occupies a different position” is narrower than “the river has permanently shifted its channel”. The larger the claim, the more additional images and contextual information matter. Missing intermediate observations should not be replaced by an invented smooth movement between the available frames. A gap in the record can remain a gap.
A river is more than a drawn line
The line on a map simplifies a spatial relationship. It helps us navigate while obscuring distinctions between water, banks and changing deposits. The documented Ucayali sequence restores a time dimension to that abstraction. “Nothing stands still” does not mean that every point migrates at an identical speed. Here it means that a landscape becomes more understandable when we place its condition within a traceable sequence. The point is not to make the river seem restless, but to identify what actually changed.
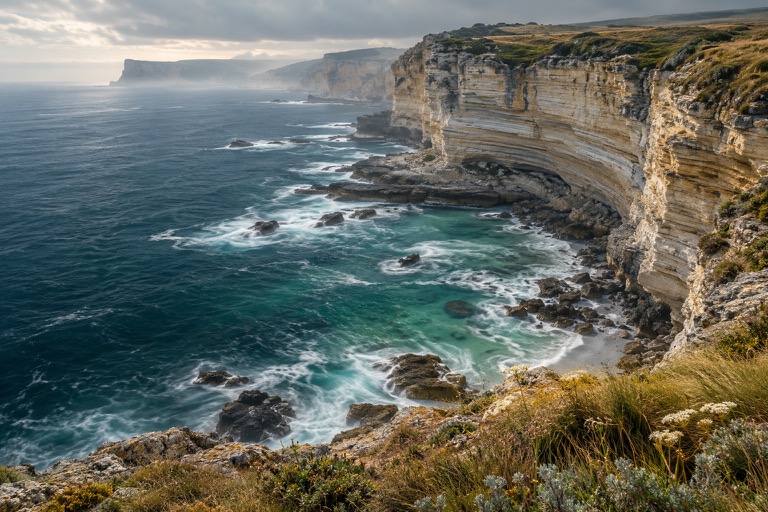
An artistic river illustration, not a satellite image of the Ucayali. Neither image nor explanatory cards presents a measured migration rate.
NASA · Sharp Bends Make Rivers Meander, As Landsat Attests ↗
A 6 February 2019 report on University of Texas at Austin research: hundreds of bends on seven Amazonian rivers over roughly three decades; Ucayali imagery spans 1985–2013. Supports the link between curvature and downstream-displaced maximum migration, not a universal forecast for engineered or geologically constrained rivers.
USGS · Rivers, Streams, and Creeks ↗
Explains catchments, surface runoff, groundwater inputs and human interventions. Used for these general relationships, without treating historical examples as present-day flow conditions.
National Park Service · Weathering and Erosion ↗
Describes channel adjustments in relation to slope, discharge and sediment, together with erosion and deposition. Simplified river age labels are not adopted as a universal development law.
NASA, USGS and NPS checked in the integrated browser on 24 October 2026. The Ucayali image comparison concerns 1985–2013; the NASA report was published in 2019.