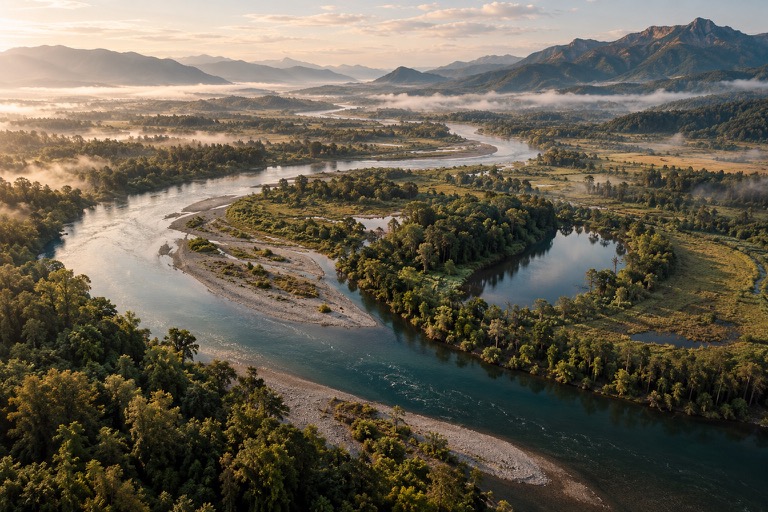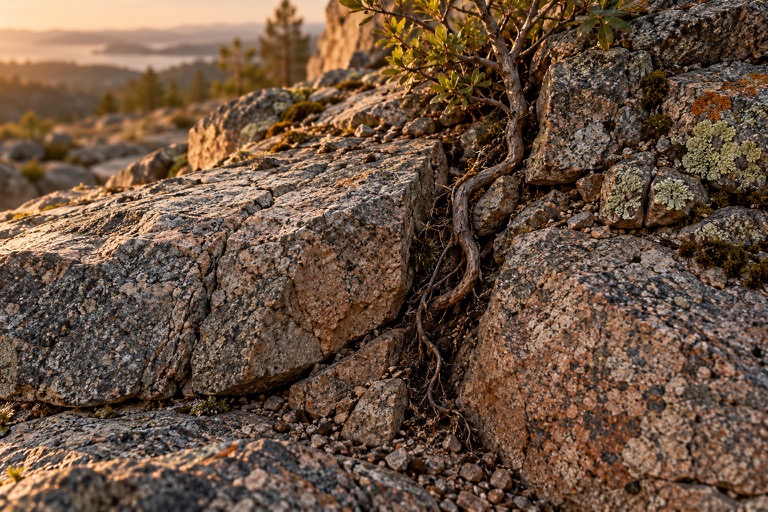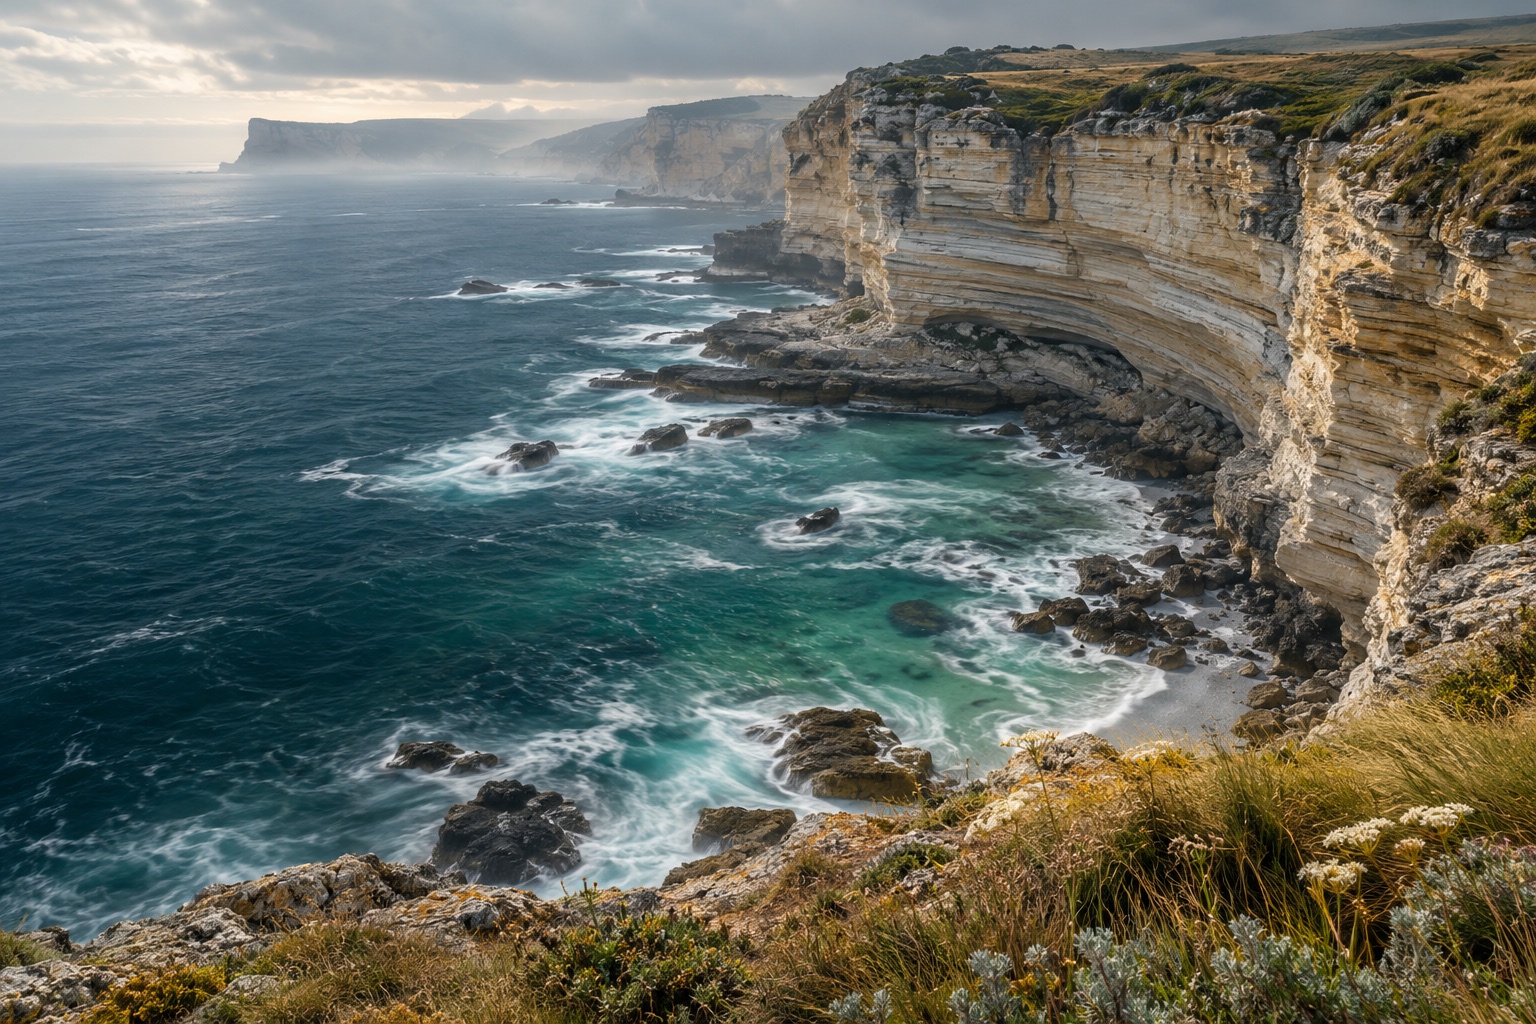
Imagine returning to a beach after several weeks. The path still ends at the same sign, but less sand lies below the steps. Farther away, the beach seems wider. This imagined scene is not a measurement. It poses a useful question: has material disappeared, or has it changed position within the coast?
A line is a choice
On a map, the coast appears as a line. On the ground there are water, wet sand, dry beach and different elevations. A comparison therefore needs a clear definition: which boundary is being examined? Two photographs taken at different water levels may show different conditions. A visible shift warrants investigation. It does not yet constitute a complete account of the beach, much less a general statement about every coast.
Waves meet material
The National Park Service describes coastal erosion through the interaction of wave action and the properties of the shore. Waves can quarry rock along existing weaknesses; moving particles can abrade surfaces. Loose sediment presents different questions from a rock face. “Strong waves” is therefore only the beginning of an explanation. Understanding the observed change also requires attention to material, geometry and the interaction actually taking place at that location. [1] [2]
Three routes through one coast.
A process comparison: the cards explain possible movements. They represent neither a particular storm nor a measured chronological sequence.
- EROSION
Material is released
Waves can detach material from a shore. Its response also depends on how the coast is built.
- TRANSPORT
Material changes location
Sediment can move along the shore or between the beach and the area offshore.
- DEPOSITION
Another location gains
Deposition occurs where material settles. A wider beach does not therefore establish that the entire coastal system has gained material.
Compiled from NPS explanations of erosion and sediment transport. [1] [2] [3]
Cape Lookout: water across the beach
The NPS illustrates overwash with a photograph from Cape Lookout National Seashore in North Carolina. Large storm waves reach areas behind the usual beach margin. This documented example shows that movement is not confined to an imagined front line. The institutional page does not, however, provide a complete before-and-after survey of that event. Its publication date must not be presented as the date of the pictured storm. A process illustration answers a different question from a measurement sequence. [1]
Sand has a source and a route
Sediment can come from rivers or eroding sections of coast, among other sources. Arriving material does not necessarily remain in one location. The NPS distinguishes movement along the coast from movement across it. For a beach comparison, the implication is that our field of attention may be smaller than the system changing it. Watching only the area below the steps can reveal a loss without establishing where the material has gone. The missing route matters to the interpretation. [3]
Erosion and growth can belong together
If material is released in one place and deposited elsewhere, two views can show different parts of the same connection. One looks narrower, the other wider. Neither establishes an overall budget without additional information. We would need the boundaries of the system, the comparison period and the quantities crossing those boundaries. “The beach is growing” therefore becomes more precise when we identify the section being discussed and the observations being compared. A local gain and a local loss are not inherently contradictory. [3]
What a useful comparison records
A traceable pair of photographs needs recognisable reference points and dates. Information about water level and the extent of the frame can also help. Calculating quantities requires further measurements. Width alone is not volume: two surfaces may be equally wide but have different elevations. This straightforward geometrical point explains why a persuasive image cannot automatically replace a sediment budget. A camera brings a question into focus; other methods may be needed to answer it.
A beach also stores material
A sediment budget must consider inputs, outputs and changes in stored material within the same spatial boundaries. This is a budget question, not a measurement series calculated here. The NPS describes relevant routes: material can arrive from rivers and eroding coasts, move along the shore or shift across it. A wider visible surface can therefore be part of redistribution. Appropriate quantity measurements would be needed to decide how the total store changed. An attractive shoreline photograph cannot supply those quantities simply by being detailed. [3]
The coast remains a connected system
“Nothing stands still” does not imply that every metre retreats at an even rate. Here it directs attention to connected processes. A calm day is a snapshot, just as a dramatic storm photograph is. Change can become visible in different directions. The coast becomes more interesting when we ask not only about a shifted line, but about material, its routes and the limits of what an observation establishes. A careful account can leave some of those questions open while still describing real movement.
An artistic AI illustration, not a photograph of Cape Lookout or a documented before-and-after pair. The explanatory cards show processes, not measurements.
National Park Service · Coastal Processes—Erosion ↗
Explains wave action, quarrying and abrasion, and the importance of material and coastal geometry. Includes overwash at Cape Lookout National Seashore. The illustration documents a process, not a dated shoreline time series.
National Park Service · Coastal Processes—Waves ↗
Institutional introduction to waves as carriers of energy at coasts. Supports the connection between waves and coastal processes, without providing a site-specific prediction for the illustrated beach.
National Park Service · Coastal Processes—Sediment Transport and Deposition ↗
Describes sediment sources and movement across and along the coast. Deposition and erosion can occur in different parts of one system. All three sources are from NPS, rather than independent monitoring programmes.
Three NPS institutional pages checked in the integrated browser on 24 October 2026. Examples and terminology come from these accounts; this article claims no new shoreline measurement.