A city can change while individual street corners remain familiar. From the pavement, we notice a demolition or a new shop. Satellite images open a different scale: they reveal changes in built-up extent. The view from above becomes especially useful when we specify the period and the kind of change it actually records.
A documented view of Las Vegas
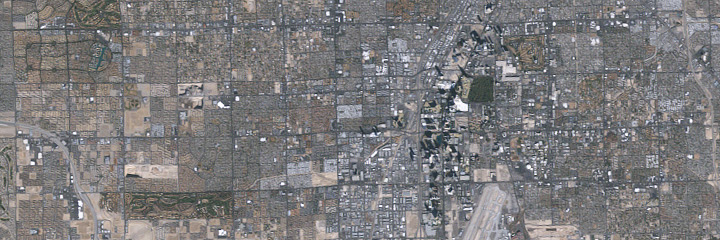
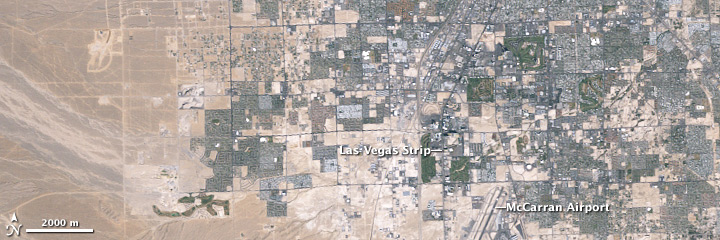
In 2009, NASA published a comparison of six Landsat 5 images of metropolitan Las Vegas. The sequence extends from 22 October 1984 to 12 January 2009. It makes the expansion of built areas visible over that historical period. The claim is deliberately limited: this is neither a current city map nor an observation made in 2026. An older comparison can nevertheless demonstrate very clearly how spatial urban change is investigated. [1]
Six dates are not a continuous chronicle
Between those endpoints are images from 29 May 1989, 28 June 1994, 9 May 1999 and 7 June 2004. Listing the dates makes the selection traceable. It does not document every construction day between them. A developed area appearing in a later image does not disclose its exact construction date. The comparison records conditions at selected moments. A more detailed building history would require additional documents and observations, rather than a more elaborate story invented between the frames. [1]
What is actually being compared?
Three levels easily confused in urban images. These are methodological comparison cards, not population growth curves.
- IMAGE
A picture has conditions
Date, season, shadows and resolution affect the visible city.
- MAPPING
Built extent is delineated
WSF Evolution compares settlement extent annually for 1985–2015. It is a specific historical data product.
- INTERPRETATION
Urban life needs further evidence
A larger built area alone establishes neither improved quality of life nor a particular population.
Las Vegas example follows NASA; distinction between WSF products follows ESA. [1] [2]
A pixel is not an individual house
NASA explains that the images have approximately 30-metre spatial resolution. They support examination of broad patterns, rather than reliable separation of individual small houses or trees. That is not a weakness a more confident caption can remove. It is a property of the observation. The appropriate question is therefore not who lives behind a particular window, but how larger surfaces and structures differ across the urban area. Scale helps determine which claims are sensible and which require another source. [1]
Green does not always mean the same process
NASA notes differences associated with seasons and shadows. A surface can therefore look different without undergoing a complete change of use. Reading colour directly as history skips those conditions. First ask whether lighting or vegetation might contribute to a visible difference. Only then narrow the interpretation. This matters particularly when images taken in different months sit side by side, their apparent simplicity encouraging us to forget that each was recorded under specific conditions. Visual persuasion does not remove that context. [1]
From an example to systematic mapping
ESA describes another approach in World Settlement Footprint Evolution: approximately seven million Landsat images were used to reconstruct annual settlement extent from 1985 to 2015. That expands the temporal comparison beyond a few selected views. It remains a particular historical product with a defined purpose. The separate WSF mapping for 2019 uses Sentinel data. These products should not be merged, either temporally or methodologically, into an assumed single uniform series. Their names and observation periods belong with the results. [2]
Built extent does not explain urban life
A settlement map answers spatial questions. It does not automatically reveal how many people inhabit a building, how they use a square or how their living conditions have changed. Those are valid questions requiring different evidence. Extent is therefore not a substitute word for progress. Nor does a visible new building explain, by itself, the reasons for its construction. A good urban account connects appropriate sources rather than requiring a single observational method to supply every explanation.
Our city is explicitly imagined
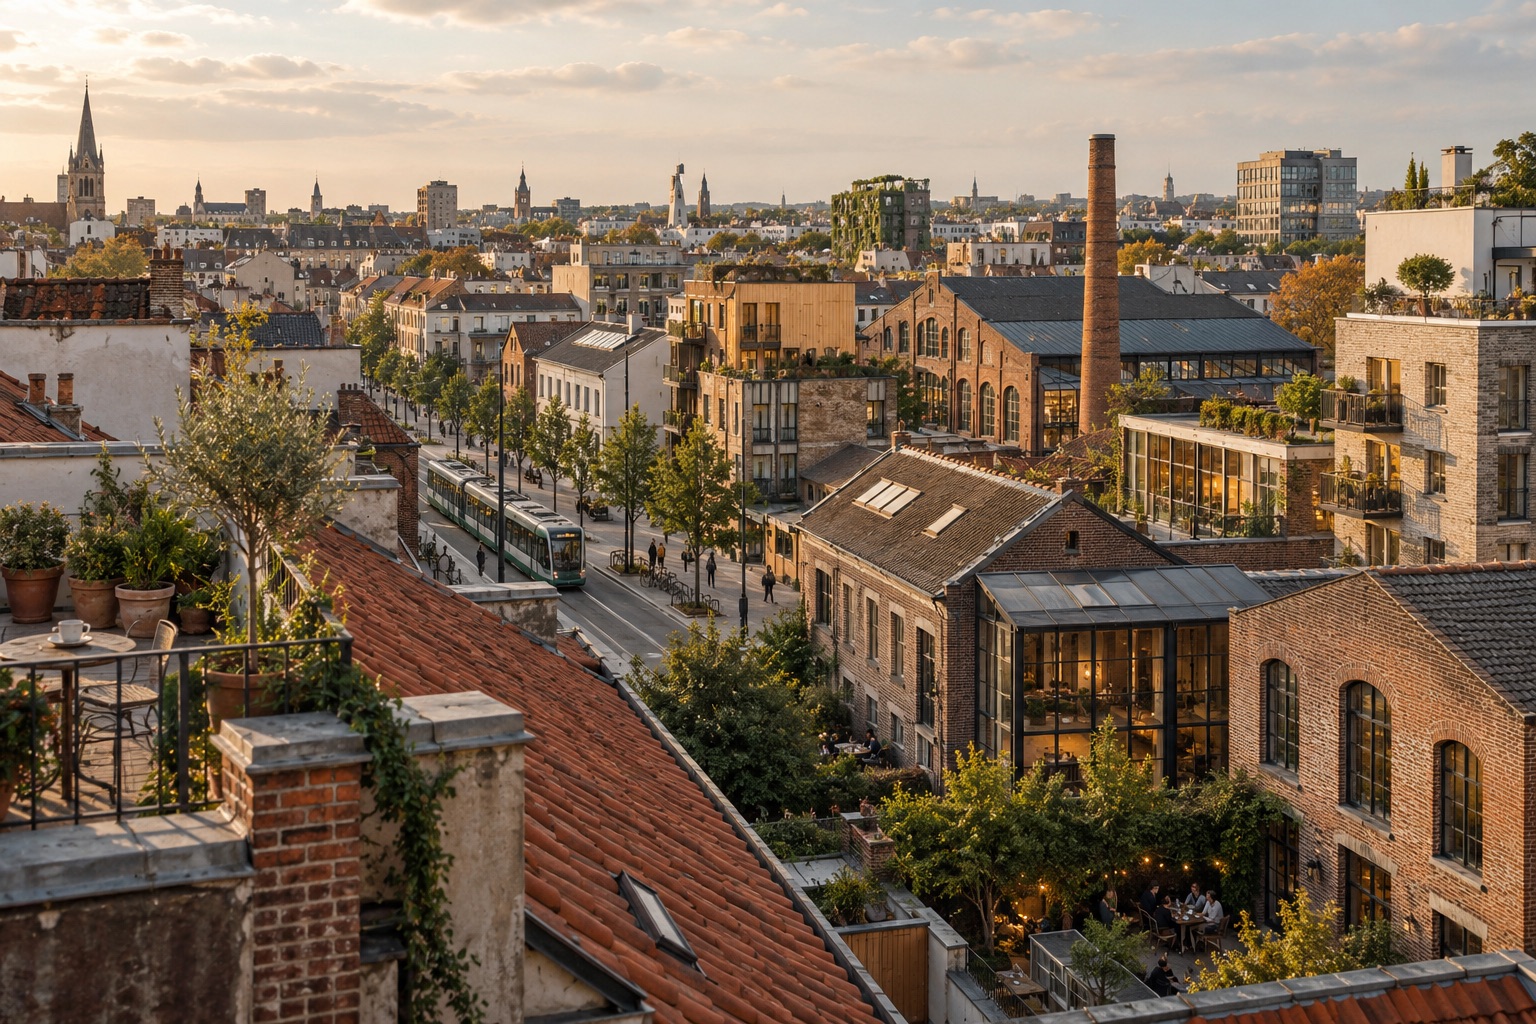
The accompanying illustration combines older brick façades with more recent urban structures. It represents an imagined city. It documents neither Las Vegas nor Erfurt and establishes no local demolition or construction history. The distinction is useful: the image directs attention to coexistence, while the sources support a specific historical comparison. You can take that visual question to a familiar street without treating the illustration as evidence about that street. Its atmosphere and the documented case have different roles.
The city contains several layers of time
Walking through a city gives us change at eye level. A satellite captures different connections. Neither view contains everything. Their relationship becomes interesting when each retains its scale and limits. The Las Vegas sequence reveals changes in larger structures; other evidence would be needed to turn it into a history of individual lives. “Nothing stands still” here means recognising different layers of time without prematurely compressing them into a single account. The city becomes more legible when its evidence remains specific.
One landscape, different times
Las Vegas · Landsat 5. Left: 22 October 1984. Right: 12 January 2009. Move the divider and follow street patterns and the spread of development.
 19842009
Also works with arrow keys. Without JavaScript the two images appear one below the other.
Two historical states, not present-day imagery. Original ground resolution about 30 metres. Season and shadows differ: colour alone is not evidence of growth or loss. The slider does not generate intermediate states.
Original series and explanation at NASA Earth Observatory ↗ · How do we recognise change? →
Everything runs in your browser. Your inputs are neither stored nor transmitted.
An artistic illustration of an imagined city. Not a photograph of Las Vegas or Erfurt, a documented construction history or a depiction of a specific satellite pixel.
NASA Earth Observatory · 25 Years of Growth in Las Vegas ↗
Historical comparison published 1 March 2009: six Landsat 5 views from 1984 to 2009. The account identifies approximately 30-metre resolution and cautions about seasons and shadows. Supports large-scale physical change, not individual households, social outcomes or present-day urban conditions.
ESA · Mapping our human footprint from space ↗
Account dated 11 November 2021. World Settlement Footprint Evolution reconstructs annual settlement extent for 1985–2015 from about seven million Landsat images. The separate WSF 2019 product uses Sentinel data. Built extent does not directly measure quality of life, population or local histories of use.
NASA and ESA checked in the integrated browser on 24 October 2026. Las Vegas concerns 1984–2009; WSF Evolution concerns 1985–2015. WSF 2019 is a separate product.