Two pictures sit beside one another. One seems greener, the other more densely built. A story quickly forms about what must have happened between them. Before explaining, another question is useful: what exactly are we comparing? Looking carefully separates acquisition conditions, visible differences and possible causes. A striking contrast can then become an investigation whose limits we are able to describe and whose next questions remain open.
An image needs a place and a date
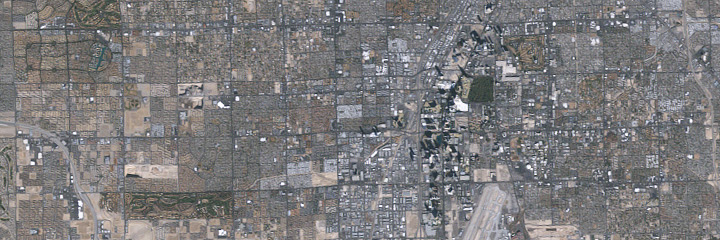
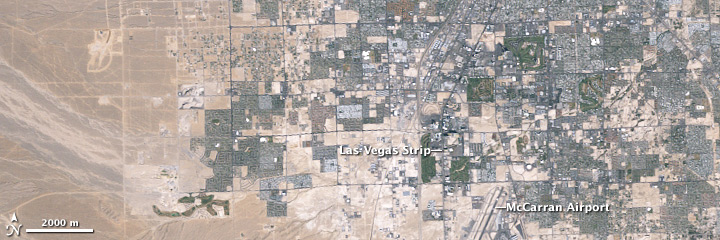
Our interactive comparison shows the same part of western Las Vegas on 22 October 1984 and 12 January 2009. These Landsat 5 images belong to a published NASA Earth Observatory series. Location and dates make the comparison traceable. They are historical snapshots. They establish neither the city’s present condition nor every individual step between the two acquisition dates that contributed to the visible differences in the area being shown. [1]
The same frame does not mean the same conditions
The images were acquired in different seasons. The accompanying account discusses weaker green colours in the winter image and shadows cast by tall buildings. These differences need not share the same cause as the spread of built surfaces. A slider helps reveal the location of structures. It neither removes seasonal effects nor retrospectively equalises illumination. Smooth controls should not make these limits disappear from the explanation or imply that the observations are identical in every other respect. [1]
Resolution determines the question
The NASA account gives an original ground resolution of approximately thirty metres. Individual houses or trees cannot be examined as if these were close-up photographs. Larger land-use changes can nevertheless become visible. Enlarging the displayed image does not create additional measurement information. We therefore ask about spatial patterns and development rather than the condition of a particular garden or the species of an individual tree. Different questions require observations at an appropriate scale. [1]
Observation, interpretation, next question.
Three stages that a comparison should keep distinct.
- Connection
Observe
A regular structure is visible in the later image.
- Connection
Interpret
Check date, resolution and season. [1]
- Connection
Ask again
Which other source can explain the proposed cause?
Images document two states. Establishing a cause needs further context. [1] [2]
Describe visible differences first
A useful note begins with observable features: where do regular street patterns appear, and which previously open areas look built over later? Interpretation follows. The account explains the spread of development into the surrounding desert. Other questions, including residents’ experiences, require different sources. Satellite imagery can complement those perspectives, but it cannot tell the entire story of a city and its social changes on its own, however striking the comparison may look. [1]
Even small colour changes have alternatives
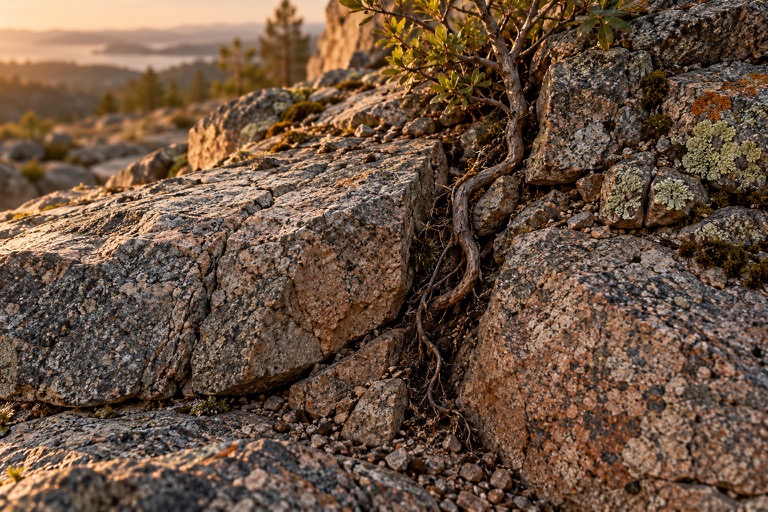
Conditions influence judgement beyond satellite imagery too. The Forest Service describes algal colours becoming visible differently in lichens when an outer layer becomes wet and more transparent. After rain, a patch may therefore look different without being entirely new growth. This example does not explain lichens in our city images. At a smaller scale it illustrates why a visible difference and the process producing it remain distinct questions, calling for their own observations and context. [2]
Two dates do not establish steady movement
A beginning and an endpoint cannot show that change proceeded at the same speed in every intervening year. The NASA account includes additional images documenting intermediate states. Other questions would require different intervals. An incomplete sequence can still be informative if it is not presented as a complete film. Our comparison therefore retains two explicitly dated states without inventing measured intermediate images, continuous movement or a constant annual rate between those acquisition dates. [1]
A record can help check memory
Someone walking a familiar route repeatedly may notice some differences immediately and others only after a long time. A dated note and a photograph from the same position can help check recollection. Conditions should be as comparable as possible: direction, light and season all matter. This is an invitation to observe rather than a prescribed scientific protocol. It nevertheless shows why an interesting question often begins with a carefully documented starting point and a repeatable view.
An open question belongs in the result
Not every cause must be resolved at the end. A useful result can be that an area visibly differs while the images alone cannot establish enough about why. Our other stories discuss coasts, material surfaces and habits. The same habit of looking helps across them: record what was actually observed, explain what the sources support, and identify which additional observation could move an unresolved question forward without pretending it has already been answered.
One landscape, different times
Las Vegas · Landsat 5. Left: 22 October 1984. Right: 12 January 2009. Move the divider and follow street patterns and the spread of development.
 19842009
Also works with arrow keys. Without JavaScript the two images appear one below the other.
Two historical states, not present-day imagery. Original ground resolution about 30 metres. Season and shadows differ: colour alone is not evidence of growth or loss. The slider does not generate intermediate states.
Original series and explanation at NASA Earth Observatory ↗ · How do we recognise change? →
Everything runs in your browser. Your inputs are neither stored nor transmitted.
Another view of change.
Watch free on ARTE. The films complement this story; they do not replace the specialist sources discussed above.
Animal (R)evolution — our Earth
Animals respond to changing habitats in different ways. An opportunity to distinguish behaviour, physiological responses and evolution.
While watching, consider: Which observations support the explanation, and over what period were they made?
Listed by ARTE as available until .
Watch on ARTE (German) ↗Listing pages checked on 25 October 2026. Regional restrictions and changes may apply. Links lead to the German version; ARTE may offer other audio or subtitle options. No video player is loaded here.
Artistic AI illustration used as a thematic motif, not a documented sample or photograph of the case discussed.
NASA Earth Observatory · 25 Years of Growth in Las Vegas ↗
Published 1 March 2009. Landsat 5 images dated 22 October 1984 and 12 January 2009; original ground resolution approximately 30 metres. Season and shadows can explain colour differences. NASA: Jesse Allen and Robert Simmon, Landsat 5 data from USGS.
U.S. Forest Service · Lichen Biology ↗
Example of an observational limit: wet lichens may reveal different colours beneath a more transparent outer layer. Colour alone does not establish a newly formed organism.
Sources checked on 25 October 2026. Comments explain the role and limits of each source.